You can also read this on my blog
Unstructured data can be challenging when it comes to storing, analyzing, and extracting value from it. Whale tracking is one example where sightings are reported by individual whale enthusiasts — primarily through Facebook groups and orca sighting websites like orcanetwork.org. However, structuring this data for further analysis and drawing meaningful insights becomes difficult.
Below are some examples of sightings reported by the orcanetwork.org community:
GRAY WHALES -
Tue, Jan 7 — Saratoga Passage (CRC22 Earhart & CRC531 Gretchen) — CRC22 Earhart — The evening was spent with beautiful grey whales CRC22 Earhart and CRC531 Gretchen and amazing friends at Camano Island State Park. This was my first encounter with grey whales from shore and my heart could not be happier. Link to FB video. -photos by Kat Martin, January 7, 202523:23 — Whale blows 1.5 miles north of Hidden Beach. -Aaron Gill
The above two sighting reports provide us humans with information at a glance. However, storing, structuring, analyzing, and visualizing this data is a challenging and tiresome task if done manually, especially since these sighting reports do not follow any standard format.
Large Language Models (LLMs) can be a game changer in this context. We use OpenAI to process the unstructured data, store the structured data in DuckDB for further cleaning and transformation, and finally, visualize the insights using Tableau.
Let’s begin!
You can access the Tableau dashboard here.
Architecture:

Part 1: Web Scraping and OpenAI
Scraping the data from https://www.orcanetwork.org/recent-sightings using beautiful soup:
import requests
from bs4 import BeautifulSoup
from markdownify import markdownify as md

# Send a GET request to the specified URL
response = requests.get("https://www.orcanetwork.org/recent-sightings")

html_content = response.content

# Use Beautiful Soup to parse the HTML
soup = BeautifulSoup(html_content, "html.parser")

element = soup.find_all('div',class_='sqs-html-content')
e = element[3]

all_content = e.contents  # or use list(element.children)

res = ""
md_list = []

# Convert the results to markdown
for content in all_content:
    res += str(content)
    mark_d = md(str(content))
    if (mark_d.strip() == "" or  '-***' not in mark_d):
        continue
    md_list.append(mark_d)
In the code above, the data we need to scrape consists of the sighting reports. The scraped data is then converted from HTML to Markdown for easier handling. The data is loaded such that each entry in the list corresponds to the sightings for a specific day.
Parsing the Unstructured Data Using OpenAI:
After generating the Markdown with the sightings, we use OpenAI’s function-calling feature to produce a structured output. The prompt is designed to process these sightings and extract the required data. Perfecting the prompt involves some trial and error to ensure it generates the correct output. It’s crucial to be explicit about column requirements and constraints to achieve the desired results. The prompt which I came up with may not be the perfect one out there but it gets the job done! I’m sure the prompt can be further perfected.
One of the primary goals is to map the locations of orca sightings by generating latitude and longitude coordinates from user-reported locations. OpenAI is leveraged for these complex tasks, and it performs remarkably well.
import json
from openai import OpenAI

client = OpenAI(api_key=userdata.get('OPENAI_API_KEY'))

system_prompt = '''
   Process the whale sightings reported by users online and output in a structured format, the sightings are reported from across the world sometimes occurring in same date with different sighting time.
   For the latitude and longitude column use the location to infer these values
   These are the column defications:
   "Date": "The date when the orca or whale sighting occurred, formatted as MM/DD/YYYY. verify the date is correct from the input provided, all the sightings in December are from the year 2024 and all the sightings in January are from the year 2025",
    "Time": "The time of the sighting, typically in 12-hour format with AM/PM indication.",
    "Species": "The species or specific ecotype of whale or orca observed (e.g., Southern Residents, Bigg's).",
    "Location": "The reported location of the sighting, often including landmarks or geographic areas.",
    "Latitude": "The latitude coordinate of the sighting location, measured in decimal degrees. only contain a numeric value",
    "Longitude": "The longitude coordinate of the sighting location, measured in decimal degrees. only contain a numeric value",
    "Reported By": "The name of the individual or organization reporting the sighting.
    "Number of Animals": "The number of whales or orcas observed during the sighting, if reported. contain a numeric value",
    "Direction of Travel": "The general direction in which the animals were moving (e.g., North, South, Northwest).",
    "Observation": "Observations about the behavior/activity of the animals, such as traveling, milling, hunting, or spyhopping. Also Additional details about the sighting, such as observer information, unusual features, or actions",
    "Males": "Indicates whether any males were identified among the group, if known.",
    "Links": "References or URLs related to the sighting or Facebook links, if available. All URL's separated by comma",
    "Raw_Text" : "All the unprocessed text from which the data was extracted from."
'''

MODEL = "gpt-4o-mini"

def parse_data(user_prompt):
    response = client.chat.completions.create(
        model=MODEL,
        messages=[
            {
                "role": "system",
                "content": system_prompt
            },
            {
                "role": "user",
                "content": user_prompt
            }
        ],
        response_format={

        "type": "json_schema",
        "json_schema": {
            "name": "sightings",
            "description": "Sightings list",
            "schema": {
                "type": "object",
                "properties": {
                    "sighting": {
                        "type": "array",
                        "items": {
                            "type": "object",
                            "properties": {
                                "Date": {"type": "string"},
                                "Time": {"type": "string"},
                                "Species": {"type": "string"},
                                "Location": {"type": "string"},
                                "Latitude": {"type": "string"},
                                "Longitude": {"type": "string"},
                                "Number of Animals": {"type": "integer"},
                                "Direction of Travel": {"type": "string"},
                                "Observation": {"type": "string"},
                                "Males": {"type": "string"},
                                "Links": {"type": "string"},
                                "Reported By": {"type": "string"},
                                "Raw_Text": {"type": "string"}
                            },
                        }
                    }
                },
                "required": ["sighting"],
                "additionalProperties": False
            }
        }
        }
    )
    return response.choices[0].message

final_results = []

for i in range(0,len(md_list)):
  user_prompt = f"""
  Here are the sightings reported in markdow, occurring in same day, each line starting with ** represents a sighting and the person reporting name starts with -:
  {md_list[i]}"""

  # Call the function on each prompt
  result = parse_data(user_prompt)

  # Parse the JSON
  parsed_content = json.loads(result.content)
  data = json.dumps(parsed_content, indent=4)
  final_results.append(data)
  print(f"Processed {i}")
The output, as specified in the function call, is a JSON object. In the end, all the responses are combined into a single output JSON object.
Part 2: Data cleaning and transformation
The data generated by the LLM requires cleaning and transformation before it can be stored and used for downstream applications. We use a combination of DuckDB and Python, as some transformations are easier to achieve in Python and others in SQL.
The JSON output list is converted into a Polars DataFrame for further transformations before being loaded into DuckDB. One common issue is that the time column generated by the LLM may sometimes contain out-of-range or incorrect time values. While this might be addressed in the prompt itself, I prefer handling it in Python for better control and flexibility.
The below code handles incorrect time data:
# Handling out of index time inference from the LLM model
#
# example cases:
# 13:00 PM; 14:35 PM

for i in sightings:
  time = i['Time']
  time = time.split(' ')
  if (i['Time'].isalpha()) or ('-' in i['Time']) or ('N/A' in i['Time']) or ('All Day' in i['Time']):
    i['Time'] = '00:00'
    continue
  try:
    if (time[1] == 'AM' or time[1] == 'PM'):
      t = time[0].split(':')
      if int(t[0]) > 12:
        i['Time'] = time[0]
  except:
      continue
Species categorization into a standard format is essential, as the species names reported by users are often inconsistent or non-standard.
# Categorizing the species
for i in sightings:
  species = i['Species'].lower().strip()
  category = ''
  if 'gray' in species:
    category = 'Gray whale'
  elif 'humpback' in species:
    category = 'Humpback whale'
  elif 'bottlenose' in species:
    category = 'Bottlenose whale'
  elif 'sperm' in species:
    category = 'Sperm whale'
  elif 'killer' in species:
    category = 'Killer whale (Orca)'
  elif 'orca' in species:
    category = 'Killer whale (Orca)'
  elif 'nurse' in species:
    category = 'Nurse whale'
  elif 'bigg' in species:
    category = "Bigg's killer whale"
  else:
    category = i['Species']
  i['Category'] = category
Upload data to MotherDuck:
MotherDuck provides a generous free tier for running your DuckDB instances along with many additional features.
After creating a MotherDuck account and setting up a database, you can connect to it using the provided connection string.
con = duckdb.connect(f'md:orca_db?motherduck_token={token}')Create a table in DuckDB using the dataframe sightings_df, this will be the raw table containing data from the source.
create or replace table orca_sightings_raw_intermediate as select * from sightings_dfThe data from the raw table is cleaned/transformed and loaded into orca_sightings_cleaned table. Here we handle type checking, data cleaning, transformation and data standardisation.
CREATE OR replace TABLE orca_sightings_cleaned AS
 (
   SELECT strptime("date", '%m/%d/%Y') AS date,
          CASE
                 WHEN "time" LIKE '%AM'
                 OR     "time" LIKE '%PM' THEN strftime(strptime("time", '%I:%M %p'), '%H:%M') -- For 12-hour format with AM/PM
                 ELSE strftime(strptime("time", '%H:%M'), '%H:%M')                             -- For 24-hour format
          END AS "Time",
          CASE
                 WHEN trim(latitude) LIKE '%[a-zA-Z]%'
                 OR     latitude IN ('Unknown',
                                     '',
                                     'TBD') THEN NULL -- Check if latitude contains letters or is Unknown/empty
                 ELSE cast(latitude AS decimal(8,6))
          END AS latitude,
          CASE
                 WHEN trim(longitude) LIKE '%[a-zA-Z]%'
                 OR     longitude IN ('Unknown',
                                      '',
                                      'TBD') THEN NULL -- Check if longitude contains letters or is Unknown/empty
                 ELSE cast(longitude AS decimal(9,6))
          END AS longitude,
          "Location",
          lower(trim(species)) AS species,
          category,
          males,
          "Reported By",
          links,
          observation,
          CASE
                 WHEN "Number of Animals" = 'None'
                 OR     "Number of Animals" = 'Unknown' THEN NULL
                 ELSE cast("Number of Animals" AS int)
          END AS "Number of Animals",
          "Direction of Travel",
          raw_text
   FROM   orca_sightings_raw_intermediate
  )
Part 3: Output the data to Google sheets and visualise using Tableau
We load the data into Google Sheets, making it accessible to everyone on the internet while allowing for frequent updates with new data.
The cleaned data is exported from DuckDB into a DataFrame before being uploaded to Google Sheets.
export_df = con.sql("select * from orca_sightings_cleaned").df()Upload the data to Google Sheets using the gspread and gspread_dataframe Python packages.
Connect to your Google service account using the credentials JSON file. Detailed documentation on authenticating and connecting to your Google account can be found in the gspread documentation.
Once connected, use the document key to access the Google Sheets document, select the desired worksheet, and use the set_with_dataframe function to load the data from the DataFrame.
sh= gc.open_by_key('Your Google sheets key')
wrk = sh.get_worksheet(0)

old_data = get_as_dataframe(wrk)
updated_data = old_data.append(export_df)
set_with_dataframe(worksheet=wrk, dataframe=updated_data, include_index=False,
include_column_header=True, resize=True)
I used Tableau Desktop to create the dashboard, connecting to the data source via the Google Drive connector. After generating the visualization, I published it to Tableau Public.
The map includes Orca sightings plotted, with additional information displayed in tooltips for a more comprehensive view.
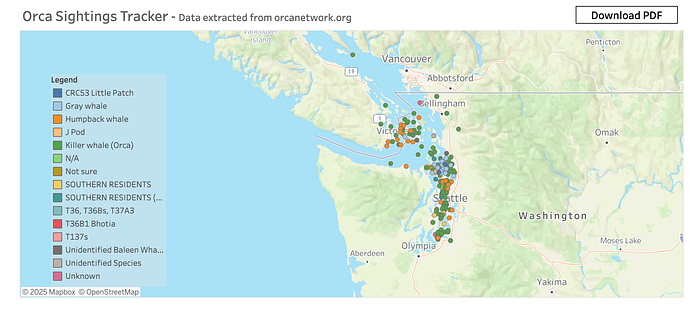
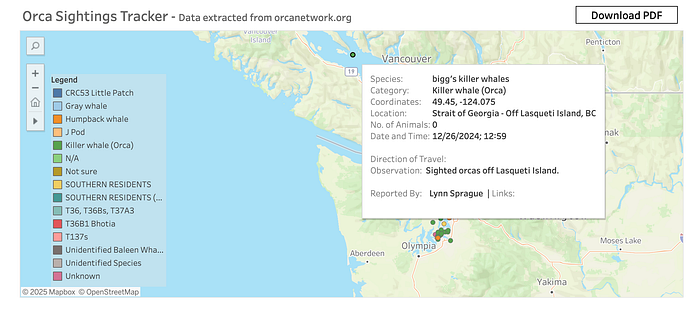
The dashboard also includes other charts and tables with more information on Orca sightings. You can access the dashboard here.

I will be uploading the code to Github soon!
Disclaimer: The data generated by the LLM is not 100% reliable, the prompt can be further perfected for all the edge cases and more data validation techniques can be applied.